
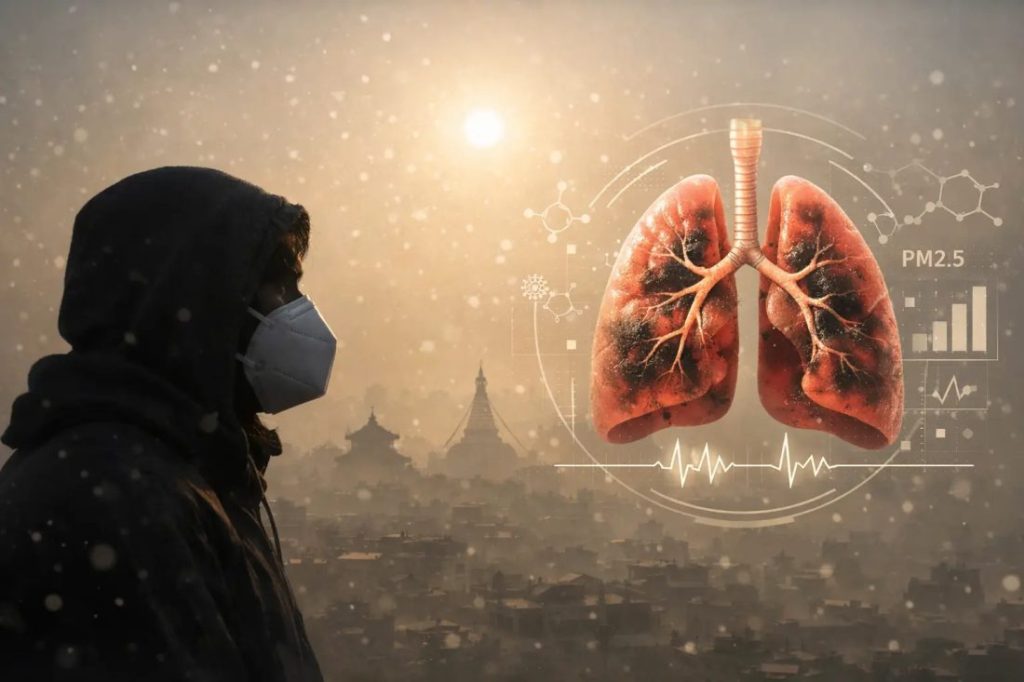
This guide explains what PM2.5 is, what it does to the lungs and heart, and what research in Kathmandu Valley hospitals has found. For what the AQI number means, read what AQI is.
What is PM2.5?
PM2.5 is particle pollution 2.5 microns across or smaller. The US EPA compares it with a human hair, which is about 70 microns thick: the largest fine particle is about 30 times thinner. A grain of fine beach sand is about 90 microns, and PM10 particles are 10 microns or smaller. You cannot see single particles. On a bad day you only see them together, as a grey haze over the valley.
How big are these particles? (diameter in microns, bars to scale)
In Kathmandu most PM2.5 comes from burning: vehicle exhaust, brick kilns, rubbish and wood fires, and forest fire smoke in spring. For the reasons the valley traps it, read why Kathmandu is so polluted.
Dust you can see and particles you cannot
The road and construction dust Kathmandu calls dhulo is mostly coarse particles, bigger than 2.5 microns. They are heavy, so they settle near the road. When you breathe them in, most are caught in the nose and throat and you cough or sneeze them out.
Fine particles behave differently. They are light enough to stay in the air and travel across the valley. The EPA says particles under 2.5 microns get deep into the lungs, and some can pass into the bloodstream. That is why they affect the heart as well as the lungs. Construction dust is still worth keeping out of the house. Our air purifier for dust guide covers that side.
What PM2.5 does to the body
In the short term
On high days, the EPA lists coughing, shortness of breath and asthma attacks among the effects of particle pollution. People with heart disease can feel palpitations, shortness of breath or unusual tiredness, and the EPA advises them to contact a doctor if that happens. These effects are stronger the more polluted the air and the harder you breathe, which is why exercise timing matters.
Over years
The long-term effects are where most of the harm lies. The WHO estimates that outdoor air pollution caused 4.2 million early deaths worldwide in 2019, and it names fine particles as the main cause. This is how those deaths split:
| Cause of death linked to outdoor air pollution (WHO, 2019) | Share |
|---|---|
| Heart disease and stroke | 68% |
| Chronic obstructive pulmonary disease (COPD) | 14% |
| Lung infections such as pneumonia | 14% |
| Lung cancer | 4% |
Most people think of air pollution as a lung problem. The WHO figures show the heart takes the bigger share.
What the research in Kathmandu Valley found
The Nepal Health Research Council measured PM2.5 for a full year, from February 2014 to February 2015, at Putalisadak in Kathmandu, Mahalaxmisthan in Lalitpur and Bhimsensthan in Bhaktapur. It matched the readings with 11,300 hospital admissions for breathing illness at 13 major hospitals in the valley.
| Finding (NHRC, 2015) | Result |
|---|---|
| Days above Nepal’s 24-hour PM2.5 standard of 40 µg/m³ | 57.6% of days |
| Rise in pneumonia admissions for each 10 µg/m³ more PM2.5 | 3.2% to 4.7% |
| Rise in other acute respiratory infection admissions per 10 µg/m³ | 2% to 2.8% |
| Rise in COPD admissions per 10 µg/m³ | 1% to 2% |
| Rise in deaths from all causes per 10 µg/m³ | 3.7% |
| Pneumonia admissions put down to PM2.5 | About 15% |
| Acute respiratory infection admissions put down to PM2.5 | About 10% |
Children under 10 made up 25.5% of these patients and people aged 50 and over about 55%. Putalisadak, in the centre of Kathmandu, was the most polluted of the three sites.
Pollution has not eased since. IQAir put Kathmandu’s 2024 average PM2.5 at 45.1 µg/m³, about 9 times the WHO yearly guideline of 5 µg/m³.
Who is most at risk?
For particle pollution, the EPA names people with heart or lung disease, older adults, and children and teenagers as the sensitive groups. People who work outside all day breathe more of it, and the EPA adds pregnant women during smoke events.
Children get their own guide: how air pollution affects children. For asthma and allergies at home, read air purifier benefits for asthma, allergies and sleep.
How to breathe less of it
You cannot clean the valley’s air yourself, but you can cut how much of it you breathe. Most of the gain comes from two places: when you are outside, and the room where you spend the night.
- Time your outdoor hours. The NHRC data shows PM2.5 peaks at 8 to 9 am and is lowest in the early afternoon. See the best time for a morning walk in Kathmandu.
- Check the reading first. Our live Kathmandu AQI shows the nearest station for 12 cities in Nepal.
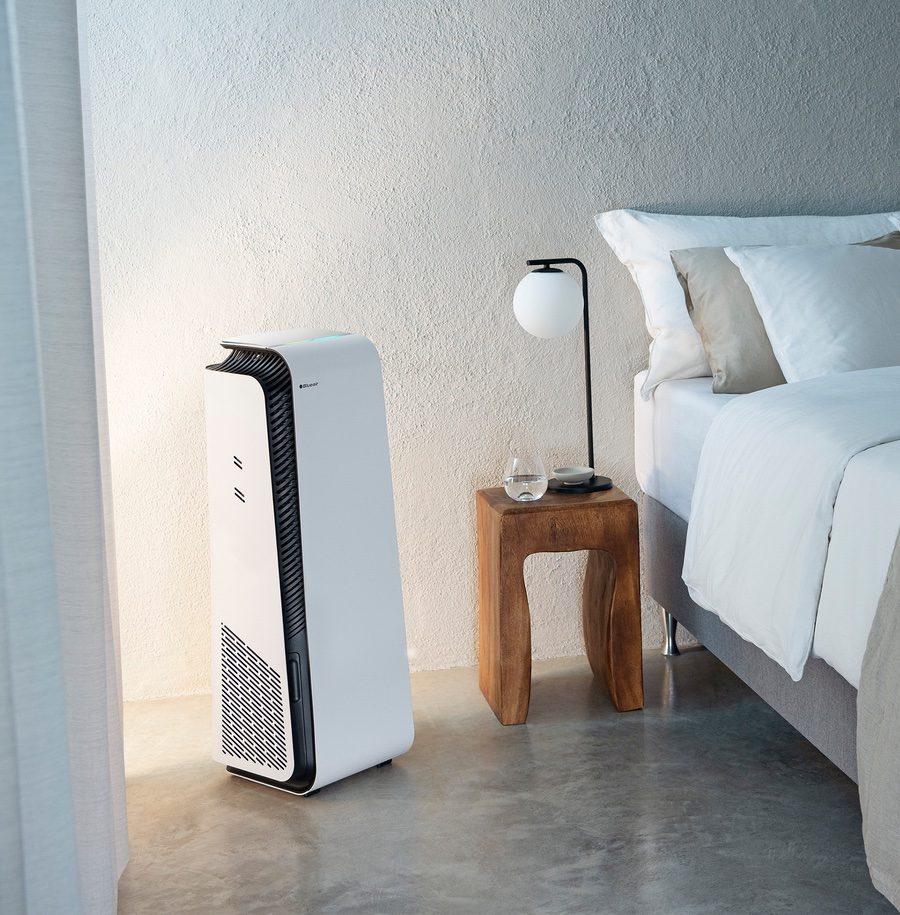
- Clean the air where you sleep. You spend about a third of the day in the bedroom, with the windows shut. A HEPA air purifier sized for the room lowers the fine particles in that air. Blueair’s HEPASilent filtration captures 99.97% of particles down to 0.1 micron. See our air purifier for bedroom picks.
PM2.5 health effects: FAQs
Can PM2.5 get into the blood?
Some of it can. The US EPA says particles under 2.5 microns get deep into the lungs and some may enter the bloodstream, which is how they affect the heart.
Does PM2.5 only harm the lungs?
No. In the WHO’s 2019 estimate, heart disease and stroke made up 68% of early deaths from outdoor air pollution, more than all lung diseases together.
How much does PM2.5 raise hospital visits in Kathmandu?
In the NHRC’s year-long study, each 10 µg/m³ rise in PM2.5 was linked to 3.2% to 4.7% more pneumonia admissions and a 3.7% rise in deaths from all causes.
What level of PM2.5 does the WHO call safe?
The WHO’s 2021 guideline is 5 µg/m³ as a yearly average and 15 µg/m³ over 24 hours. Nepal’s 24-hour standard is 40. Our Kathmandu AQI page compares the two.
Sources and references
- Situation analysis of ambient air pollution and respiratory health effects in Kathmandu Valley, 2015, Nepal Health Research Council
- Ambient (outdoor) air pollution fact sheet (4.2 million deaths in 2019 and causes), World Health Organization
- WHO global air quality guidelines 2021, World Health Organization
- Particulate Matter (PM) Basics (particle sizes), US Environmental Protection Agency
- Technical Assistance Document for the Reporting of Daily Air Quality (health effects and sensitive groups), US EPA, May 2026
- Kathmandu among the most polluted cities in the world (2024 average PM2.5), IQAir