
Kathmandu’s AQI usually sits in the unhealthy range in winter and drops in the monsoon. The live number above is on the US EPA scale, from 0 to 500. A higher number means dirtier air.
What each AQI number means
The AQI runs from 0 to 500. A higher number means dirtier air. These are the six bands used by the US EPA, the same scale shown in the reading above.
| AQI | Level | What it means |
|---|---|---|
| 0 to 50 | Good | Little or no risk from the air. |
| 51 to 100 | Moderate | Acceptable for most people. A small risk for people who are unusually sensitive to pollution. |
| 101 to 150 | Unhealthy for sensitive groups | Children, older people and people with asthma, heart or lung conditions may feel effects. |
| 151 to 200 | Unhealthy | Everyone may start to feel effects. Sensitive groups may feel more serious ones. |
| 201 to 300 | Very unhealthy | A health warning. Everyone is more likely to be affected. |
| 301 and above | Hazardous | Emergency conditions. Everyone is likely to be affected. |
For the full explanation, read what AQI is and what it means for your health.
What to do when the AQI is high
From 101 upward, sensitive people should limit time outdoors. From 151 upward, everyone should. Keep windows closed while the reading is high, and run an air purifier in the room where you spend most of your time. Open them again to air the room once the reading falls, because a closed room builds up CO₂ and moisture that a purifier does not remove (why air purifiers do not remove CO₂).
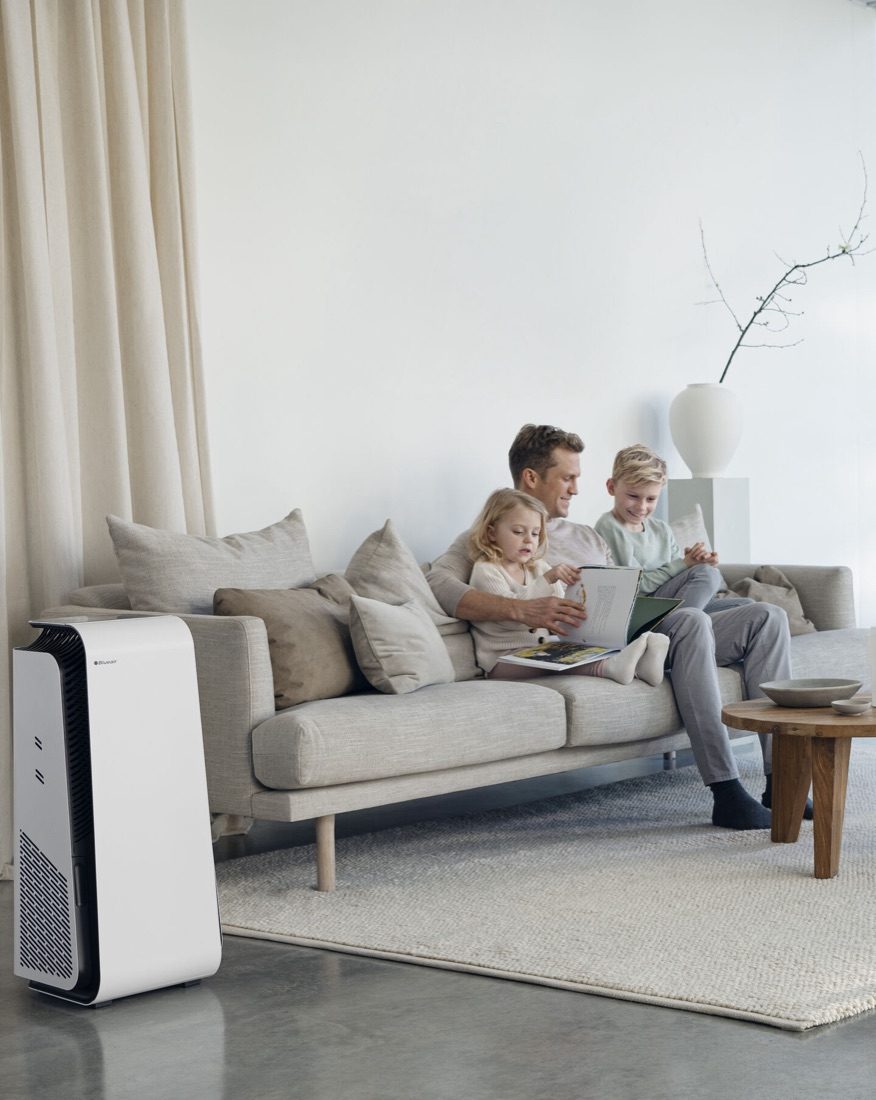
You cannot change the air outside, but you can clean the air in the room where you live and sleep. An air purifier pulls the room air through its filter again and again. Blueair’s HEPASilent filtration captures 99.97% of particles down to 0.1 micron, which covers PM2.5, dust and smoke. Read how a HEPA air purifier works.
Air purifiers for your home, shop or office
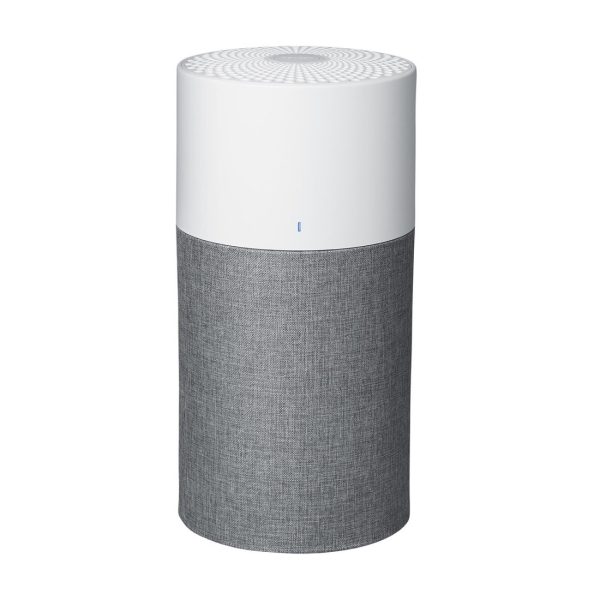
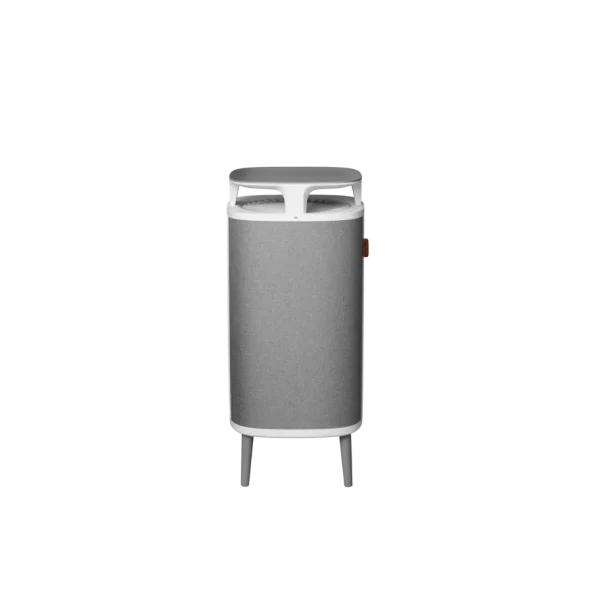
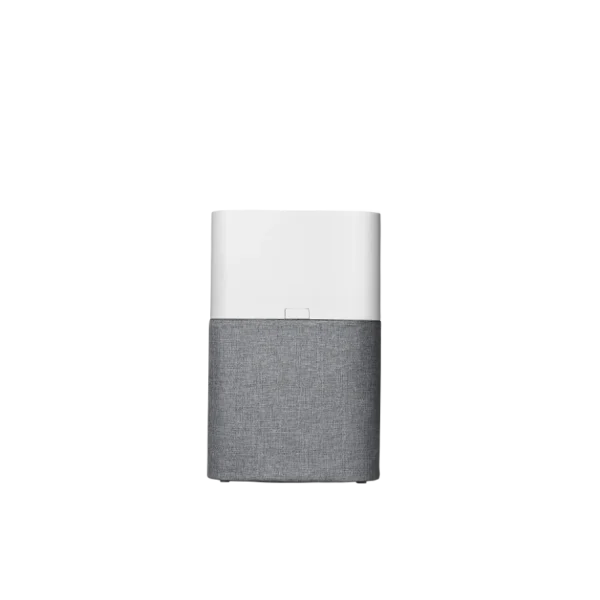
Bedrooms and living rooms. Run it with the windows shut on high-AQI days.
A shop on a busy road takes in dust all day. These catch it before it settles on your stock.
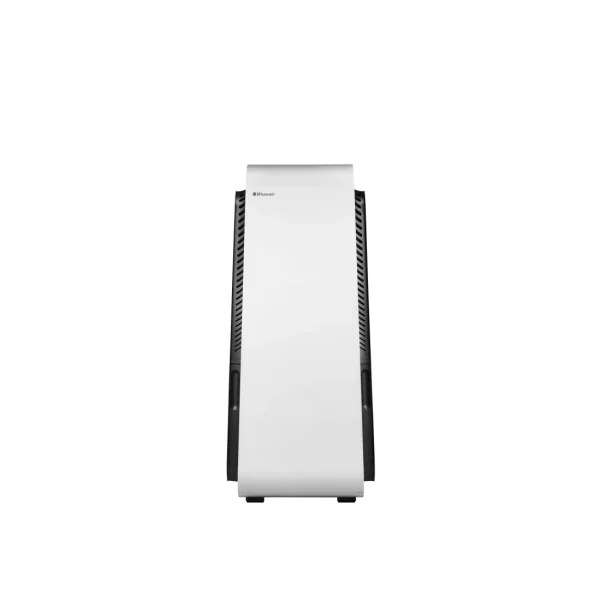
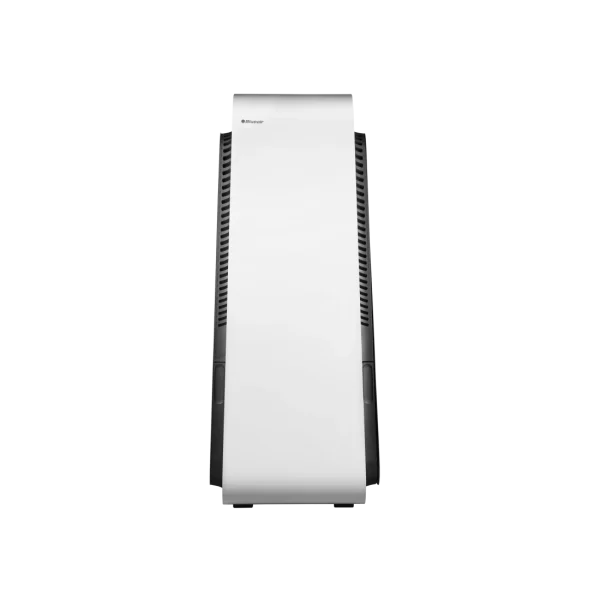
Bigger rooms and many people breathing the same air.
- Swedish designBlueair is designed in Sweden and sold in over 60 countries.
- Award-winningRed Dot, iF Design and German Design Award winner.
- Looked after in NepalLocal warranty, genuine filters in stock and help on WhatsApp.
- Delivered across NepalFrom Kathmandu to Biratnagar, Pokhara and Dhangadhi.
AQI in Kathmandu, Pokhara and other cities of Nepal
Each city has its own reasons for bad air. Here is what drives it, when it is worst and where our reading comes from.
Kathmandu Valley AQI: Kathmandu, Lalitpur and Bhaktapur
45 Kathmandu AQI now: Good Kiran Chok station Open in the live reading
51 Lalitpur AQI now: Moderate Pratik Galli station Open in the live reading
51 Bhaktapur AQI now: Moderate Pratik Galli station Open in the live reading
Kathmandu sits in a bowl ringed by hills. On cold, still days the air does not move out of the valley, so smoke and dust build up. The main sources are vehicles, construction dust, brick kilns and burning waste or wood. In spring, forest fire smoke adds to it.
IQAir put Kathmandu’s 2024 average PM2.5 at 45.1 µg/m³, about 9 times the WHO yearly guideline. Lalitpur and Bhaktapur share the same valley air, so their readings usually rise and fall with Kathmandu’s. Our readings come from stations such as Ratnapark, Shankapark, Bhaisipati and Birendra School in Bhaktapur.
Pokhara AQI
82 Pokhara AQI now: Moderate model estimate Open in the live reading
Pokhara’s air is usually cleaner than Kathmandu’s, but spring is different. In 2024, forest fires burned about 5,000 hectares around the city from February, and farmers in the Terai burned fields before planting maize.
By late April the AQI was above 150, the haze hid Machhapuchchhre and the Annapurna range, and flights were held up for hours. The smoke stays until the rain comes. Our reading comes from the GBS and Pokhara University stations.
Chitwan AQI
137 Chitwan AQI now: Unhealthy for sensitive groups model estimate Open in the live reading
Chitwan is in the inner Terai. A 2026 study of PM2.5 across Nepal found the inner Terai cleaner than the main Terai belt, but still a health worry in winter.
The same study found rural Sauraha as polluted as nearby towns, so living outside the city does not mean cleaner air. April forest fires push readings up here too. Our reading comes from the Bharatpur station.
Butwal AQI
157 Butwal AQI now: Unhealthy model estimate Open in the live reading
Butwal, Bhairahawa and Lumbini are in the western Terai, the second most polluted region in the same 2026 study. Readings rise right after the monsoon and stay high through winter, partly from pollution that blows in from across the border.
Burning crop stubble after harvest is common in Rupandehi, Nawalparasi and Kapilvastu, and adds smoke. Our reading uses the Lumbini station, about 30 km away.
Biratnagar AQI
162 Biratnagar AQI now: Unhealthy model estimate Open in the live reading
The eastern Terai had the highest PM2.5 of any region in the 2026 study. Winter is the worst time: readings climb after the monsoon and stay high until spring.
Biratnagar has no public monitoring station of its own. Our reading uses the nearest one, usually Damak, about 45 km east, and switches to a model estimate when no station is reporting.
Birgunj, Hetauda and Janakpur AQI
95 Birgunj AQI now: Moderate NH36 station Open in the live reading
45 Hetauda AQI now: Good Kiran Chok station Open in the live reading
165 Janakpur AQI now: Unhealthy Siraha-12 station Open in the live reading
These cities follow the same winter rise as the rest of the Terai. Birgunj and Hetauda also sit on Nepal’s main industrial road, and the 2026 study found that places near industry have their own pollution pattern, separate from the towns around them.
Our readings come from the Simara, Hetauda and Janakpur stations.
Nepalgunj and Dhangadhi AQI
153 Nepalgunj AQI now: Unhealthy model estimate Open in the live reading
128 Dhangadhi AQI now: Unhealthy for sensitive groups model estimate Open in the live reading
In the far west, Nepalgunj and Dhangadhi follow the western Terai pattern: dirty air from the end of the monsoon through winter, and cleaner air in the rains. Both cities have their own stations, which our readings use.
We deliver Blueair air purifiers to every city on this list. Message us on WhatsApp with your city and room size and we will suggest the right model.
Kathmandu air quality by season
Kathmandu’s air is at its worst in the dry, cold months and at its best in the monsoon. Cold, still air holds smoke and dust inside the bowl of the valley. In March and April, forest fires across the country add to it. Monsoon rain washes the air, although readings can still sit above the WHO guideline.
| Season | What to expect |
|---|---|
| Winter, December to February | The highest readings of the year. Cold air sits still in the valley and traps pollution. |
| Spring, March to April | Still high. Forest fire smoke adds to the dust and vehicle fumes. |
| Monsoon, June to September | The lowest readings, as rain clears the air. |
The months in between sit between these. Source: ICIMOD and a NepJOL study of Kathmandu PM2.5, linked under Sources.
For the best hours of the day, read the best time for a morning walk in Kathmandu. For the reasons behind it, read why Kathmandu is so polluted.
Where the AQI number comes from
The AQI is not one measurement. Monitors measure each pollutant, such as PM2.5, PM10 and ozone. Each one is turned into its own AQI score, and the number you see is the highest of them. In Nepal that is usually PM2.5, the fine particles that travel deep into the lungs.
Our reading comes from the nearest monitoring station when one is close and reporting. In Nepal these are mostly the Department of Environment’s stations, such as Ratnapark and Shankapark in Kathmandu. If no station is close enough or recent enough, the page shows a model estimate instead and says so under the number. Either way the figure is on the US AQI scale and refreshes about every 10 minutes.
Why two apps show different numbers
Different stations, different times and different scales explain most gaps. A monitor beside a busy road will not match one in a quiet neighbourhood a few kilometres away, and some apps use the Indian or European index instead of the US one. Check which scale an app uses before you compare.
Before you trust any reading, check four things: which station it comes from, when it was last updated, whether it is measured or a model estimate, and which scale it uses. A reading from a station 2 km away and 20 minutes old tells you more than a city average from yesterday. The government’s own station readings are on the Department of Environment air quality portal.
Outdoor AQI is not your indoor air
This page shows the air outside. Your purifier measures the air inside the room, so its number can differ. Our guide on why an air purifier stays red explains the gap, and what PM1, PM2.5, PM10 and VOC readings mean explains the numbers on its display.
Nepal’s air quality standard compared with WHO
Nepal’s National Ambient Air Quality Standards of 2012 set the limit for PM2.5 at 40 µg/m³ over 24 hours. The WHO guideline is 15 µg/m³. Nepal’s limit is more than twice as loose.
| Pollutant, 24-hour average | Nepal standard (2012) | WHO guideline (2021) |
|---|---|---|
| PM2.5 | 40 µg/m³ | 15 µg/m³ |
| PM10 | 120 µg/m³ | 45 µg/m³ |
WHO also sets yearly guidelines of 5 µg/m³ for PM2.5 and 15 µg/m³ for PM10. Studies of the valley’s air, including Department of Environment reports, find PM2.5 above the national limit.
Kathmandu AQI FAQs
What is the AQI in Kathmandu today?
The live reading is at the top of this page and refreshes about every 10 minutes. In the cold, dry months it often sits in the unhealthy range, and in the monsoon it is usually much lower.
What is the AQI in Pokhara today?
Pick Pokhara in the live reading at the top of this page, or see the table of Nepal’s cities. Pokhara’s air is usually cleaner than Kathmandu’s, but forest fire smoke in March and April can push it into the unhealthy range.
Which part of Nepal has the worst air?
In a 2026 study of PM2.5 across Nepal, the eastern Terai had the highest levels, followed by the western Terai. Kathmandu Valley is also often unhealthy in winter. The city table on this page shows which city is worst right now.
Why is Kathmandu’s air so bad?
The valley is a bowl. On cold, still days, smoke and dust from vehicles, construction, brick kilns and burning stay trapped over the city. In spring, forest fire smoke adds to it. The daily pattern is in why Kathmandu’s air is worst in the morning and evening.
What is a good AQI level?
0 to 50 is good. 51 to 100 is moderate and acceptable for most people. Above 100, sensitive groups should cut down on time outdoors.
Is an AQI of 150 safe?
At 101 to 150, sensitive groups such as children, older people and people with asthma, heart or lung conditions may be affected. Most healthy adults can go out but should avoid long, hard exercise.
Why does the AQI differ between apps?
Apps use different stations, update at different times and some use a different scale. Compare apps on the same scale and in the same hour. Our AQI explainer covers the scale.
Which AQI scale does this page use?
The US EPA AQI, from 0 to 500. The bands and colours on this page are the EPA’s.
Does an air purifier help when the outdoor AQI is high?
It cleans the air inside the room. With windows closed, a HEPA purifier removes fine particles such as PM2.5 from the room air. Choose one sized for your room: see the air purifier for home guide.
Sources and references
- US EPA AirNow, AQI basics (bands and how the AQI is calculated)
- WHO, global air quality guidelines 2021
- Nepal Department of Environment, air quality status reports (yearly reports on the station network) and its air quality portal
- Nepal Health Research Council, Situation analysis of ambient air pollution and respiratory health effects in Kathmandu Valley, 2015 (national PM2.5 standard of 40 µg/m³ and a year of valley readings)
- ICIMOD, No respite from choking air for valley dwellers
- NepJOL, Monitoring air quality in Kathmandu (seasonal PM2.5)
- Live readings: AQICN station data and the Open-Meteo air quality model (Copernicus CAMS)
- IQAir, Kathmandu among the most polluted cities in the world (2024 average PM2.5 and sources)
- The Kathmandu Post, Air pollution takes its toll on Nepal’s tourism capital (Pokhara, April 2024)
- Shrestha and others, Comparative assessment of urban and rural PM2.5 concentrations across physiographic regions of Nepal, Journal of Environment Sciences, 2026
- Bajracharya, Mishra and Maharjan, Determinants of crop residue burning practice in the Terai region of Nepal, PLOS ONE, 2021
- History chart: Open-Meteo air quality model (Copernicus CAMS), daily average of hourly US AQI